Being a data-driven company means dealing with, well, data. But it’s not enough to just have the data — you also have to be able to use it effectively. This often involves manipulating the raw data so it’s easier to process, understand, and, ultimately, use for decision-making. This article will show how to create a report in Oracle APEX based on a database column containing a colon delimited list. The report will show the number of times that each list item appears in the database. And as a bonus, we’ll cover how to show each item’s percentage of the total.
The Challenge
For our example, I have created an exit survey form that asks users to specify their job title. On the form, I have a checkbox page item that allows users to select any of the choices that apply to them. The list includes Analyst, Back-End Developer, Database Administrator, Front-End Developer, Network Administrator, and Project Manager. We want to show the collected data as an APEX report that displays how many users selected each option. When a user submits the survey, the response is stored in the database as a colon delimited list containing all the options they checked. Here’s how one hypothetical response might look:
Analyst:Back-End Developer:Project ManagerParsing The Colon Delimited List Data
Within APEX, we can parse this data and return counts of each possible response in the colon delimited list. We do this using the LIKE operator. In the example below, I’ve given the response ‘Analyst’ an alias of ‘alst’ to make it easier to read.
select count(ID)
from SURVEY_RESPONSE
where ANSWER_01 like '%Analyst%') as alst;
Building the Query in APEX
We can then tailor that query for each of the possible responses that might reside in the database and nest them as subqueries in a larger select statement, like this:
select distinct
  (
    select count(ID)
    from SURVEY_RESPONSE
    where ANSWER_01 like '%Analyst%') as alst,
  (
    select count(ID)
    from SURVEY_RESPONSE
    where ANSWER_01 like '%Back-End Developer%') as b_e_dev,
  (
    select count(ID)
    from SURVEY_RESPONSE
    where ANSWER_01 like '%Database Administrator%') as db_a,
  (
    select count(ID)
    from SURVEY_RESPONSE
    where ANSWER_01 like '%Front-End Developer%') as f_e_dev,
  (
    select count(ID)
    from SURVEY_RESPONSE
    where ANSWER_01 like '%Network Administrator%') as n_a,
  (
    select count(ID)
    from SURVEY_RESPONSE
    where ANSWER_01 like '%Project Manager%') as p_m
from SURVEY_RESPONSE;
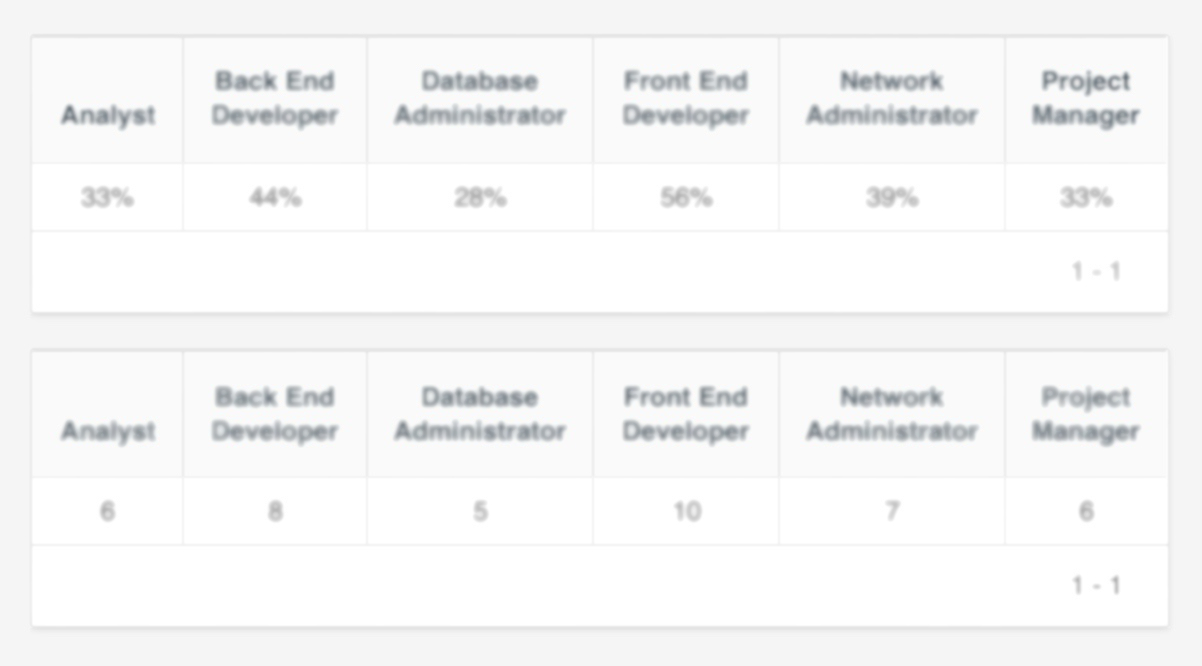
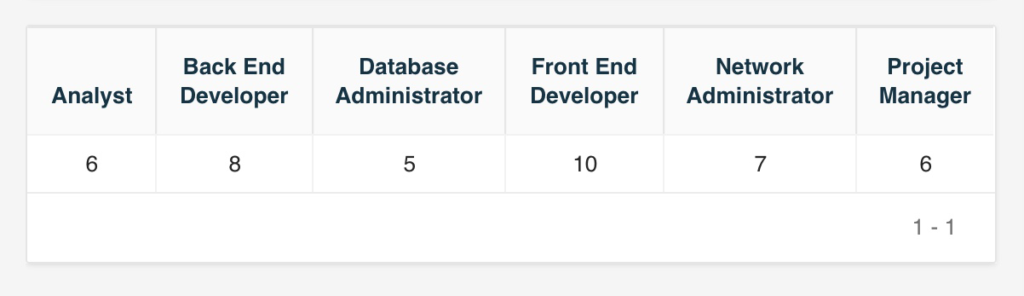
We can then create a new report-type region in APEX Page Designer, and set the ‘source set’ as this longer query. If done correctly, you should see a count of each potential response, corresponding to the number of times it appears in the database. Now, instead of just seeing which choice each user selected, we can a count how many users selected each choice.
Bonus Lesson: Showing Colon Delimited List Results as a Percentage in APEX
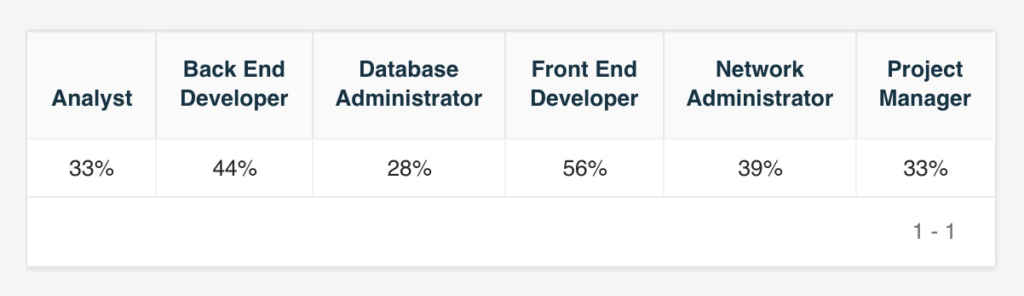
What if we want to see the percentage of users in each category, rather than just a count? In that case, we should alter our nested sub-queries to use a math operator. We can divide our count by the number of respondents in a sub-subquery, like so:
select distinct round((
  select count(ID)
  from SURVEY_RESPONSE
  where ANSWER_01 like '%Analyst%') / (
    select count(ID)
    from SURVEY_RESPONSE
  ) * 100, 0) ||''|| '%'
from SURVEY_RESPONSE
This query first grabs a count of the selected response (in this case ‘Analyst’), then divides it by a count of total responses. We then multiply the result by 100, and concatenate it with a percentage symbol. When each query is nested into a larger query (as in the larger sample above), the resulting statement will return a percentage-style number for each possible result. This final report provides a very useful display of our data, so we can better understand the kind of work our users perform.
Learn More
We are passionate about making custom business software that helps companies perform better. Interested in learning more about how Traust can help you make the most of your business data? Contact us today.